Query: Come this Wednesday, 16 December, shall the Policy Statement from the Federal Open Market Committee confirm their having voted to nick the Federal Reserve Bank's overnight lending rate from 0.25% up a notch to 0.50%? Answer: As interpreted via FedFundsFutures, which over the past two weeks of FedSpeak have skewed themselves up to as much as 0.415% -- the highest reading since December 2008, before pulling back in yesterday's (Friday's) equities demise to settle at 0.385% -- we remain in an apparent 22% minority of "No". Yes, we're crediting the Committee's members as having too much real-world common sense to make the move ... silly us!
But not similarly crediting them is Gold. Gold knows they'll vote to raise the FedFunds rate to 0.50%. Gold has, by our modest estimate, already priced in the ensuing +0.25% pip a bazillion times over, and then some.
If you do your history, the FOMC's initial hint of a rate hike came better than one year ago in their 29 October 2014 Policy Statement, which also marked the conclusion of Quantitative Easing Part Trois, after which Gold was sold to settle on that day at 1211. Obviously today at 1074, Gold has since been sold over and over, time and again, on the same reasoning that a FedHike can only mean both the StateSide Dollar and Economy are comparatively robust vis-à-vis the balance of the wobbling world. The misbelief of "Dollar up, Gold down" remains prevalent, (the non-stop burgeoning supply of dollars be damned).
Oh, make no mistake about it: given the recent passage of time, FedSpeak has been biased toward this "imminent" rate hike, whilst throughout, our declining Economic Barometer has been biased against any rate hike. And as we turn to the Econ Baro, we've added its declining dashed regression line, which is more suggestive for the FOMC to at best "stand pat", notably given the return of equity market "turmoil", an element which as you know has been recently FedStated as a FedHike "no-no":
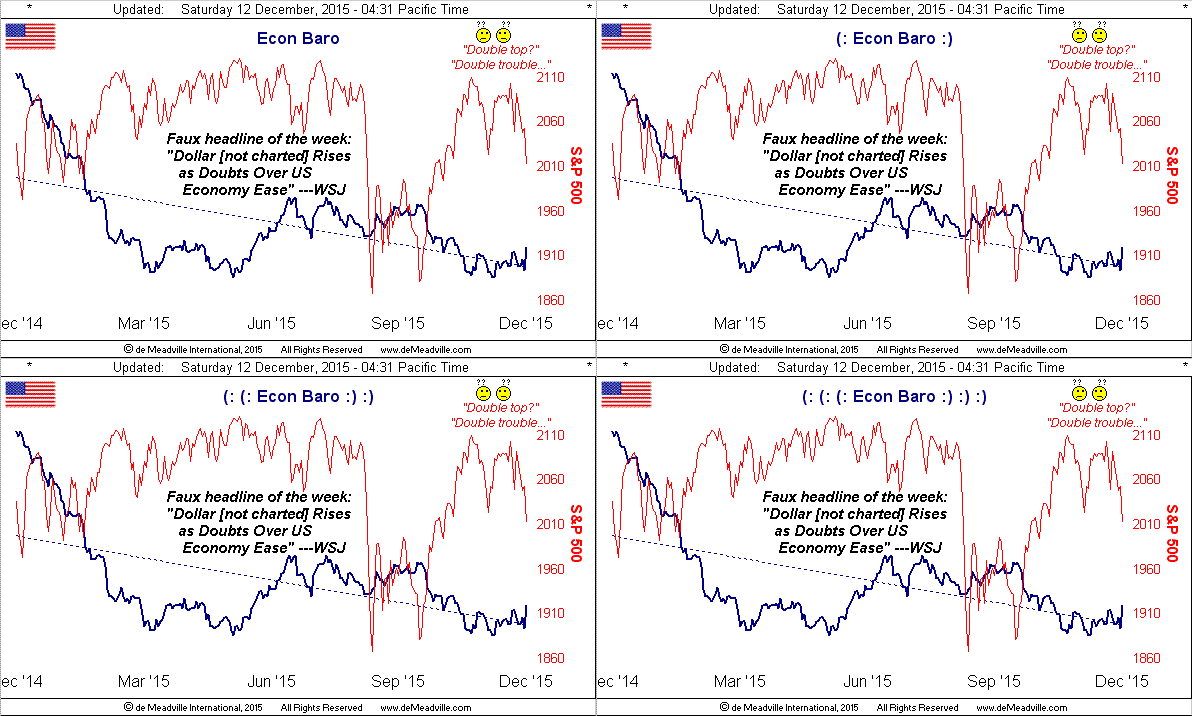
In the Fed's favour, they did get a pop in yesterday's release of November wholesale inflation. But as for the above embedded WSJ quip, here's the dollar's performance for the week just past, (60-minute readings) ... Oh that "Dollar strength!":
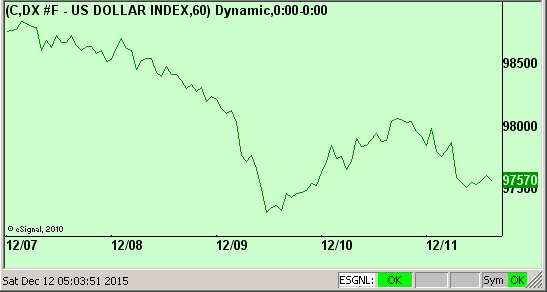
'Course, the unavoidable reality is that any "strength" due the dollar is its ever-increasing supply, and in turn the inevitable positive rub for Gold. Therefore, as noted a week ago, a FedHike come Wednesday might actually be favourable for Gold per the antithetical adage of "Sell the Rumour, Buy the News". Here's why:
Logically, (albeit the FOMC doesn't apparently see it as such), come Wednesday we'll have a wash: the FedFunds rate going up despite the Econ Baro going down. The rumour ends, the news is out, credit's at a greater cost, the economy still remaining lost. Then soon to be uttered will be the big "UH-OH", and Gold thus ought rightly "snap back" at least to where 'twas (i.e. 1211) post-29 Oct '14 Statement. Besides, since that date -- sans QE III -- the Fed has nonetheless further debased our currency by almost three-quarters of a trillion dollars (the M2 money supply having increased by some $725 billion, an amount greater than Switzerland's annual gross domestic of $703 billion).
In fact, for those of you scoring at home, as the "common sense mitigant" to currency debasement, Gold rose from the turn of the millennium into 2012 at an average pace of $128/oz. for each $1 trillion of M2 creation. So in adding that to an initial rally for 1211 gets us to 1339, which clearly makes more sense. 'Course per our Gold Scoreboard at this missive's open, we ought today already be at 2560. Talk about gettin' off course! Here's Gold "once-astride" the strengthening supply of M2 millennium-to-date, denoted with some of our rather infamous quips that were made en route:
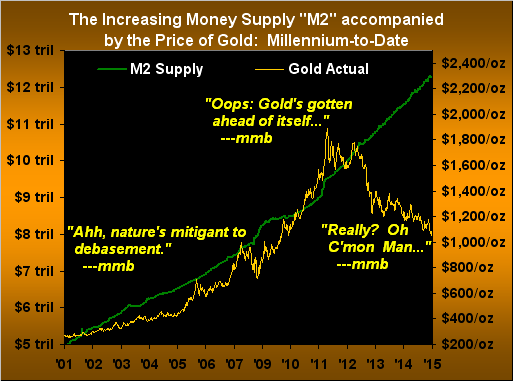
And before you percentage people get out your HP-12Cs and say that price today is right about where it ought be, don't forget that during M2's four-fold increase from $1 trillion to $5 trillion, Gold lagged terribly, only to finally catch up, indeed overshoot in 2011, but to have since overly-fizzled whilst the money supply has continued soaring ever upward. Moreover, given the lowly level of Gold today, its next overshoot of M2 ought be nothing short (pun!) of satisfying.
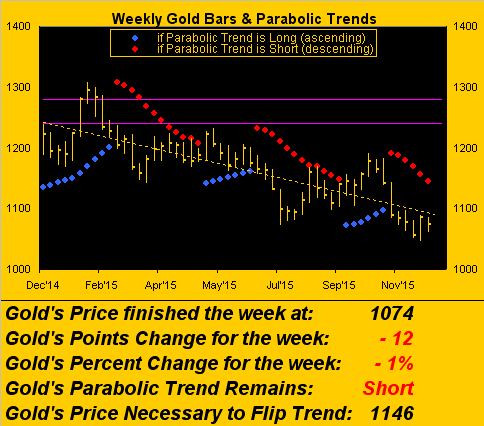
As for said lowly level, let us turn to Gold's weekly bars, wherein we see the parabolic Short trend as denoted by the red dots now six weeks in duration. Indeed, the past week's rightmost bar is quite stubby considering that stock markets appear on the verge of (to use a technical expression) blowing their Christmas cookies: this past week the S&P 500 traded 140% of its "expected weekly trading range", whereas having quietly traded just 66% of same was Gold. But at least the latter made a "higher low":
To be sure, Gold certainly seems to be dawdling through here, especially given the week's aforeshown selling in the dollar, offset by buying in the EuroCurrencies, not to mention the S&P selling spree. In this next two-panel graphic of daily bars for the past three months, on the left we've the Swiss franc, (the chart for the euro looking quite similar), and on the right we've Gold. They've fairly similar tracks, as traditionally these two majestic markets oft make, until most recently. 'Course, Chairman Thomas Jordan of the Schweizerische Nationalbank can't be overly pleased with President Mario Draghi of the European Central Bank, the latter's not-dovish-enough move a week back in turn not working to keeping a lid on the euro, let alone that of the "overly-valued" Swiss franc. And c'mon Gold! Don't you see that your "Baby Blues" denoting trend consistency are rising? Time for price to get with the program:
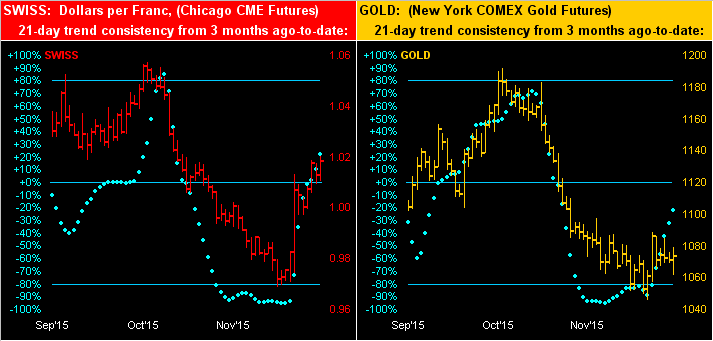
Still, in the midst of it all, China gets welcomed into the world reserve currency basket, the renminbi only to then get summarily whacked, having just hit a four-year low as money flees the slowing economy. In with the yuan, but out with the dough.
Meanwhile "Little Oil" is getting the blame for the S&P's becoming lame. Coming below is the same two-panel drill in our next graphic for Oil (left) and the S&P (right). However, we see the problem as monumentally larger than just a lower Oil level: the last time Oil, (Friday's settle 35.36), was trading in the 35s was during February 2009 in the wake of the Black Swan's pounding. Anybody remember what the price/earnings ratio of the S&P was then?
"Uh, I think it was 14x, mmb..."
Very good, Squire. Today, almost triple that, is our "live" calculation at 44.5x, with a variable rate-disruptive FedHike waiting in the wings. Talk about a fine case for financial disintegration: think of all that dough complacently thrown into the stock market "savings account" toward securing a safe retirement. Did we mention "UH-OH"? Cue Bachman Turner Overdrive: ![]() "You ain't seen nothing yet"
"You ain't seen nothing yet"![]() ('74). Here you go:
('74). Here you go:
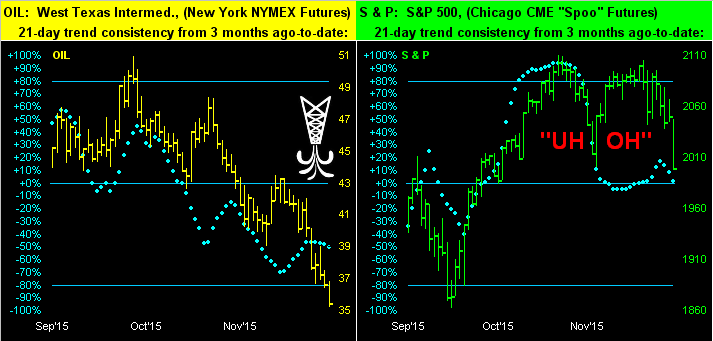
A grand way for these great markets to be positioned going into the FedHike, eh? What is it that they're so bent on toward raising the FedFunds rate? Is it that amongst the world's other central banks, ours just wants to be different? Is it just a case of near-term optics credibility? Is it a kinda raison d'être sorta thing? Stand by for the new clarion cry: "Raise today, Rescind tomorrow!" (To which, if you're filling out your calendar for next year, note 27 January as the FOMC's first 2016 Policy Statement date). Goodness. Let's get to the Precious Metals Market Profiles, then to The Gold Stack, and finally a brief mention of why most of us apparently aren't around anymore.
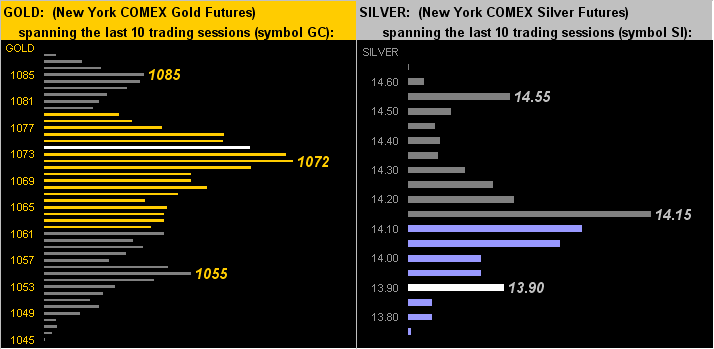
The lengths of the bars in these Market Profiles depict the contract volume traded per price point over the past 10 trading days. With an eye to both panels' white bars denoting yesterday's respective settles, for Gold (left) we're just above trading support at 1072, whilst for Sister Silver (surely adorned in her industrial metal jacket, rather than in her precious metal pinstripes) she's beneath trading resistance at 14.15, tediously sitting on support at 13.90:
As for the stack, here 'tis:
The Gold Stack
Gold's Value per Dollar Debasement, (from our opening "Scoreboard"): 2560
Gold’s All-Time High: 1923 (06 September 2011)
Gold’s All-Time Closing High: 1900 (22 August 2011)
The Gateway to 2000: 1900+
The Final Frontier: 1800-1900
The Northern Front: 1750-1800
On Maneuvers: 1579-1750
The Floor: 1466-1579
Le Sous-sol: Sub-1466
Base Camp: 1377
Year-to-Date High: 1307
Neverland: The Whiny 1290s
Resistance Band: 1240-1280
The 300-day Moving Average: 1172
The Weekly Parabolic Price to flip Long: 1146
10-Session directional range: up to 1088 (from 1045) = +43 points or +4%
Trading Resistance: 1085
Gold Currently: 1074, (weighted-average trading range per day: 16 points)
Trading Support: 1072 / 1055
10-Session “volume-weighted” average price magnet: 1069
Year-to-Date Low: 1045
In closing, the Great Pew has weighed in our nation's populous. Seems us middle-classers now make up less than half of it at 49.9%. 'Course, San Francisco and its Silicon Valley environs likely are skewing the report, for practically the poorest person able to get by here would clearly be considered in the top 1% anywhere else across the nation. Indeed we read this past week that the cheapest house on the market here in The City is presently asking $599,000. We even recently heard of a bar in the once-barrio now high tech denizen's Mission District wherein 30-somethings think nothing of throwing $100 at a martini. Believe me, we're gonna need a few when the wheels come off, (and hopefully at vastly reduced prices).
In the meantime, don't dread the Fed; just get some Gold instead!